
ATLAS e-News
23 February 2011
Daily luminosity plots get the all-clear
27 April 2010
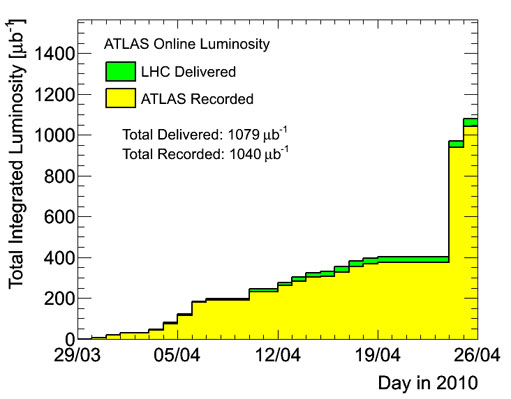
Summary of cumulative luminosity showing the jump in luminosity last weekend
A collection of plots giving an overview of ATLAS luminosity and collision statistics has been ‘conceptually approved’ for public viewing. The plots are updated daily and show information starting from March 30th, when high-energy collision data-taking began.
“These kinds of plots basically get shown in every single conference talk, because it just shows how well we’re taking data and how much data we’re taking,” says Data Preparation Deputy Coordinator, Beate Heinemann, who was overseeing the creation of the plot resource, along with Data Preparation Coordinator, Andreas Höcker. Metadata Co-coordinator, Eric Torrence, developed the framework that creates the plots and updates them automatically.
“This is only the tip of the iceberg, these plots. There’s a whole infrastructure underneath that plots a lot more detail, for us to review,” says Beate. Indeed, it is possible, internally, to look at detailed luminosity statistics in two-minute intervals, but the Data Preparation group decided that plots given as a function of day would be much more useful for non-experts.
“These high level plots are for people speaking at conferences, but basically we hijacked the detailed script, which is for the LHC and our Run Coordinators, to produce these plots for public consumption,” says Beate.
In having the plots ‘conceptually approved’ – for style and expected content – the Data Preparation group has made it straightforward to show a bang-up-to-date overview of the luminosity and collision situation at ATLAS, while data is spilling out in a minefield of approved and yet-to-be-approved plots.
Of course, some small-scale approval mechanism still exists – the automatically generated plots are checked for technical glitches each morning at the Run Meeting, as the previous day’s data-taking is being discussed.
“We basically vet it that it looks ok, that it displays things correctly, and then we just copy it over,” says Beate. “It’s reading from a database, so it’s just nice for a human to see it and say, ‘Indeed, that makes sense’.”
The public plots show integrated luminosity and observed collision events, both cumulatively and as a function of day, as well as a record of the maximum instantaneous luminosity delivered per day. For the integrated luminosity plots, the luminosity the LHC delivers is shown in green, and the luminosity that ATLAS records is shown in yellow – providing an at-a-glance assessment of ATLAS’s data-taking efficiency each day.
For interested collaborators, more detailed plots are available (not to be shown publically), describing beam spot characteristics, Trigger rates, and luminosity stats as a function of hour.
 Ceri PerkinsATLAS e-News
|