
ATLAS e-News
23 February 2011
The Run Query Tool
30 November 2009
After one year break, events are arriving in ATLAS again and many people's attention is shifting to the data we take. Keeping track of this data is one challenge, presenting that information in a condensed yet digestible manner another. That is where the ATLAS run query tool comes into play.
For each run that we take with the ATLAS detector a whole set of additional information to describe the data comes along with it. This run-wise meta-data gives us a brief overview on the basic properties of the data and the running conditions and helps us categorize our data sets for detector studies and physics analysis.
The ATLAS run query tool gathers this meta-data from three different databases. The SFO-database, where SFO stands for the trigger sub-farm output, contains information about the data streams that were filled by the trigger, their sizes and correlations. The Tier0-database knows about the prompt processing status of each data run, the names of the resulting datasets and their availability for fast detector calibration. Most input though comes from the ATLAS conditions database. This includes the configuration of the detector (encoded in the “detectormask”) and the trigger (described by the trigger menu and release number), the data quality, the magnetic field, and the event counts. Recently information about the LHC status has been added, so the ATLAS run query tool can now provide associative information between the beam conditions and the data. The conditions database organizes its content by run and luminosity block number, where a luminosity block is - beyond an event - the smallest unit of data we record. Further it allows to freeze data by assigning conditions tags, a feature that is important to track potentially volatile information such as data quality assignment.
When the idea of a run query tool for ATLAS data was first conceived, three principles were defined that are driving the design. The tool should have a simple interface, yet provide the flexibility of customizable queries, support the further use of the query by saving the result and providing links to related information, be web-based, to avoid the need of setting up the ATLAS software.
So let's have a look at the web version of the tool (http://atlas-runquery.cern.ch). The user input field was inspired by the search interface of the HEP literature database Spires. The query command is a single string of keywords paired with criteria for selection and display. Having a single string has the further advantage that the tool can be used from a shell command line in the very same way. That string is interpreted by a parser before being sent to the core query machine. That way the user interface is much more flexible in its acceptance of input. Below the input field, a collection of query examples is given, grouped by the different categories of information. That is all the information one needs to get started, so let's delve into it a bit more.
The ATLAS run query tool looking at the three most recent runs, after specifying the show all option. (click for full image)
In general one can put a selection criterion on each information that can be displayed. When the page is first opened a standard query is selected as default, which, with the exception of data quality, returns all information about the last 10 runs. Results are listed in reverse order, the first run being the most recent one, perhaps still ongoing.
The presented information is grouped, run statistics first, then magnet status, trigger configuration, LHC condition, and finally data stream statistics and detector status. For each run the second column contains a set of hyper-links to the run summary web page, the AMI interface, the data quality portal, the Point 1 ATLAS electronic log book, and the detector control system (DCS). Another useful link further to the right leads to the trigger configuration pages, with details on the setup of the Level 1 Central Trigger and of the HLT trigger algorithms. The trigger can change during the course of a run, so sometimes more than one link is given.
Not part of this overview is information about the data quality. Data quality flags range from black to green and exist for all detector systems and for each trigger signature and combined performance group. They are determined at different steps in the reconstruction and validation cycle and reflect the usefulness of the data for physics analysis. A trigger on-call expert for instance would say “show dq trig” to look at the trigger related data quality flags. While holding the mouse over a particular data quality field he or she can see the comments from the data quality shifter, and so quickly get an overview of the trigger quality of the data.
Other excellent web pages for run information are available. Among these
are the run summary and the run-status displaying in-time information about the ongoing
run.
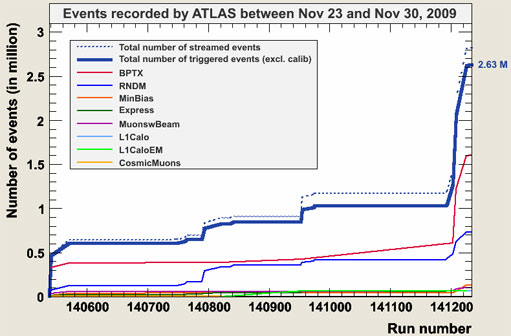
Accumulated number of triggered and recorded events during the last November week. This plot can be retrieved with the Run Query by specifying show summary".
In the end, we hope to have designed a tool that helps everyone from the ATLAS control room to the analysis computer desk to get a quick overview of all aspects of ATLAS data.

Joerg StelzerDESY |

Andreas HoeckerCERN
|