
ATLAS e-News
23 February 2011
The good, the bad, and the flawed
18 May 2009
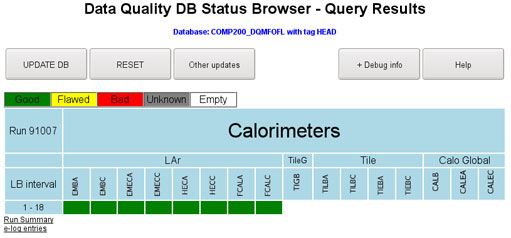
Flags on calorimeter data.
As our detector is debugged with the first collision data later this year, our early physics analysis will benefit from a flagging system that tells us what data are good for analysis. The flags, first mentioned in October last year, are based on histograms of the data which are checked against expected distributions.
Flags start at the subdetector level. They are placed automatically or by a shifter in the control room: green for no problems, amber for fixable problems, and red for unusable data.
The amber flag is a temporary step on the way to a simple red/green system. “We think we can recover this information. It looks like there’s something we don’t quite understand. We don’t think this is bad data; we just think it’s imperfectly understood data,” says Peter Onyisi of the Data Quality (DQ) group. For instance, a calibration error can make the values wrong, but the distribution may still be correct. Shifting the data set to adjust for this error can salvage the data – it doesn’t need to be thrown out.
As another temporary step during cosmic runs, a gray flag indicates that there is simply not enough information to make a decision; a small sample that doesn’t match the expected distribution. The gray flag withholds the red flag judgment, but it will disappear as ATLAS begins taking LHC data. Peter acknowledges that as an end user, “maybe” is not something you want to deal with.
The flagging system is still a bit over-sensitive to problems – the software is somewhat hasty to throw a red flag on data with minor problems. For this reason, users can look at red-flagged data and override the software’s decision if necessary.
Like the trigger and Grid, the flag system is tiered. Primary flags are placed at the subdetector level, assuring that a particular chunk of data is good or warning that it is not.
Then, the secondary level considers the flags on chunks of data from different subdetectors to decide if the data is usable for measuring particles and jets. For instance, an electron track would include information from the Pixels, SCT, TRT, and LAr. Flags from these four subdetectors would determine whether a particular chunk of data is good for analyzing electrons. The combined performance groups decide on how to flag physics objects.
The tertiary flags are on the end user’s tier – physics analysis. Here, the flags from the physics objects are combined to determine whether or not the data can be used to find the Higgs or a supersymmetric particle, among other phenomena. “A physics group can say, ‘I need electrons, I need muons, and I need jets,’ and combine those flags to say whether a chunk of data is usable,” Peter explains.
He describes the team behind this system as: “a somewhat odd group. It’s small and basically consists of people who are in charge of different components.” Especially at the primary flag level, the software-builders need to collaborate closely with the subdetector groups, so many in Data Quality are “on loan” from a subdetector. Other than the DQ group coordinators, Michael Hauschild and Mario Martinez-Perez, none of the crew has a specific title.
In parallel with the groups hard at work in the cavern during the shutdown, the DQ group has been refining its system. “A lot of effort has gone in from the detector side to improve automatic checks,” says Peter. They have also worked closely with the physics object and analysis groups to make sure that the flagging software is accurate at each level.
ATLAS is currently awakening in a sense, as each system participates in “slice weeks”, running its various parts in relative isolation. The subdetector groups use the data flags and data quality histograms, among other checks, to diagnose any remaining problems to solve. “Everyone is making sure that they’re up again, leading up to a cosmic run at the end of June where everyone comes in together,” says Peter.
Beyond software, the group is working on expanding the user interface with the data quality system. As an example, Peter says: “We’re working on a webpage now that will display at a glance the critical information, so you can say, ‘Aha, here’s the status of the detectors right now. Here is the history of the last five runs; this is the reference that we should compare to.’”

Katie McAlpineATLAS e-News
|