ATLAS e-News
23 February 2011
Data Drill: Analysing FDR-1 and M5
Some User experiences
13 May 2008

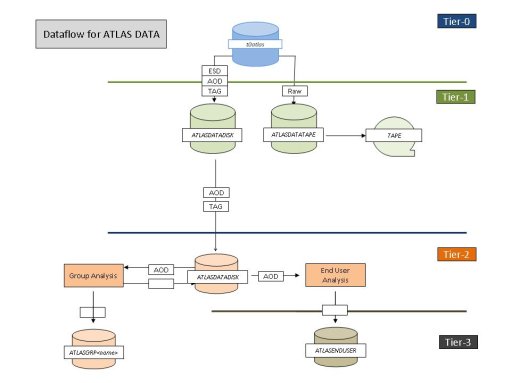
Diagram Data Flow through the ATLAS Collaboration
As described in previous e-news articles (Full Dress Rehearsal for ATLAS Debut (15 Jan), A Perspective on the Success of FDR1 (10 Mar)), the ATLAS full dress rehearsal (FDR) is intended to test all computing components and data-preparation steps on the path from writing raw-data files from the data-acquisition system to analysing these data at remote computing centers. The previous e-news articles have focussed primarily on the pre-analysis phase of FDR-1; this article will concentrate on the analysis phase and especially on user experiences.
ATLAS computing is built on a four Tier system:
Tier-0 (T0): CERN
Tier-1 (T1): Large regional computing centers
Tier-2 (T2): Sub-regional computing centers
Tier-3 (T3): University-group size computing facilities (or even a single laptop)
According to the computing model, the reconstruction of the experiment data occurs at the T0 and T1 centers and the AOD and TAG files (and perhaps some limited ESD files) are transferred to the respective T2 centers for further analysis, perhaps making use of (and transfering data files to) the various T3 sites. A T1 center and its associated T2 and T3 sites are referred to as a "Cloud" (ATLAS has 10 in all) and we attempted to gather information on the FDR-1 and M5 users experiences at each cloud. Not suprisingly, most clouds discovered infrastructure issues which had to be dealt with before users could make effective use of the respective T2 facilities. At the time we made our inquiries (early April 2008), the Canadian, Dutch, German, Nordic, Swiss, Polish, UK, and US T2 facilities provided input to us.
In addition to the FDR, another test of the distributed computing system has been made with the analysis of the milestone-run data, especially the M5 run data. The findings on data distribution of both M5 and FDR-1 were essentially positive with a few small issues being flagged for future improvements.
It was found that essentially all M5 analysis was performed in Canada and the US by a small group of experts. In the US the work was performed only at the T1 whereas in Canada the reconstruction was performed at the T1 and analysis was performed via the GRID on the T2s and on local T3s (one of which was a 16 cpu PROOF test cluster). Again, no major issues were found although further improvements and optimizations were indicated.

The very first users studying the reconstructed FDR data came from the monitoring communities and were able to quickly check the properties of jet events, the content of the express stream, the distribution of primary vertices, and the result of duplicate event filtering with an assortment of tools. These groups uncovered the first evidence of a rounding error in the cross-sections, problems in interpreting the trigger results, and some duplicated chunks of data in the raw files, all in time for the FDR data preparation group to update the analysis tools and even to generate ‘bugfix’ samples.
In parallel, concerted efforts such as the FDR-1 Jamboree in the US and a non-localized but focused effort in the UK caused the number of physics-oriented users to grow quickly in the latter part of March 2008. Many of these groups intended to study the backgrounds to small cross-section processes like top pair production, and were quite surprised to find that large numbers of top, Z, and high-pT QCD events had sneaked into the dataset. They continued their analyses undaunted, trading tips on the hypernews forum and TWikipage.
Concerning Distributed Analysis, AMI (the Atlas Metadata Interface) and DQ2 (a data management/locator toolset) were used to find summary information about the available FDR datasets, and both of the grid job submission tools (PANDA and GANGA) were tested. Users reported some minor frustration in locating the AMI portal but were otherwise satisfied with the distributed analysis infrastructure.
Using homemade TAG files, an improved trigger decision tool, various derived physics dataset (DPD) makers, and the many ways to extract a distribution from an ntuple that are available, they have created the panoply of distributions presented in the FDR-1 User’s meetings (http://indico.cern.ch/categoryDisplay.py?categId=1377). While the unlikely cross sections that the users encounter while exploring the FDR-1 universe have disrupted their accustomed cross-checks of trigger and reconstruction efficiencies, these pioneers are bravely accepting the challenge of understanding a dataset without the usual standard candles.
While what was tested seems to have worked reasonably well, it should be noted that only a small fraction of the collaboration participated in the FDR-1 analysis effort, and the level of testing of the computing system in differnt geographical regions was very variable. It remains to be seen how the system will respond with much more (real) data and many many more users. A wider user participation in FDR-2 is thus an important goal.

Ayana HollowayLawrence Berkeley National Laboratory |

Jim CochranIowa State
|