
ATLAS e-News
23 February 2011
Virtual Point 1 provides interactive 3D display of detector and event data
22 July 2008
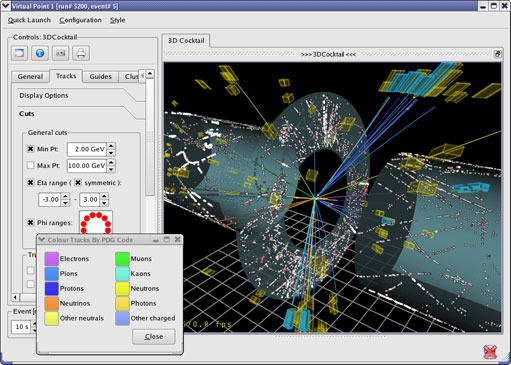 VP1 is used here to display truth tracks and reconstructed calorimeter
clusters, as well as TRT hits projected onto three projection planes (click for larger image)
VP1 is used here to display truth tracks and reconstructed calorimeter
clusters, as well as TRT hits projected onto three projection planes (click for larger image)
In the spring of 2007, work started on a new event display for
ATLAS. This display was named "Virtual Point 1" (VP1 for short), in
reference to the location of the ATLAS detector: Point 1 at the LHC.
What sets VP1 apart is its primary focus on providing a hardware
accelerated 3D interactive display of detector and event data. But
just as importantly, it is integrated directly in the ATLAS offline
software framework, Athena. This means that VP1 can use any type of
event data supported by ATLAS, and since it uses the native Event Data
Model (EDM), it has automatic access to detector alignments and
calibrations.
With access to an offline software release, most users will want to
launch VP1 on an event file, such as the Event Summary Data (ESD) and
Analysis Object Data (AOD) files created as output of reconstruction
jobs, simply by typing "vp1 myeventfile.pool.root". While waiting for
a new ATLAS stable release, interested users can download updated
versions of VP1 for any release from the VP1 website. Advanced users
might wish to instead launch VP1 directly from their custom Athena
jobs, being able to investigate the contents of each event directly as
it is being supplied. The combination of having a 3D display and of
being integrated directly inside Athena is very powerful, and allows
for very truthful representations of data. A particularly important
benefit of this, which has already proven itself again and again over
the last year, is that software problems that could otherwise be very
hard to track down, can often be instantly recognised and understood
once associated data is visualised in VP1.
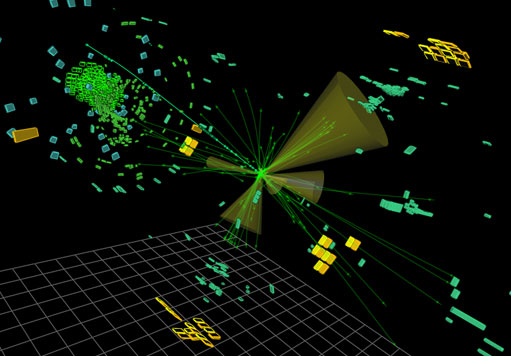 Reconstructed tracks and jets are shown here along with a more
detailed view of the calorimeter data, showing the individual cells in
the various calorimeter subsystems (click for larger image)
Reconstructed tracks and jets are shown here along with a more
detailed view of the calorimeter data, showing the individual cells in
the various calorimeter subsystems (click for larger image)
The tight integration within the offline software means that VP1 has
direct access to ATLAS helper tools. An example of where this is being
used is in the display of tracks: In order to save on disk space, only
a few points on each track are usually stored in data files. To
reproduce a truthful representation of those tracks in an event
display, one obviously needs to interpolate the trajectories between
those points, taking into account in particular the complex magnetic
field of ATLAS. In VP1 this interpolation is carried out with a few
calls to the extrapolation tools normally used by the reconstruction
algorithms. Additionally, it is possible to use ATLAS standard track
fitters to refit the tracks in real time. Another interesting example
of the benefits of running inside Athena is the integration with the
FatRas fast simulation: Not only can VP1 be used to display the events
generated by FatRas, but when run in single particle mode ("vp1
-fatras"), it is even possible to steer the event generation settings
from within VP1, click "next event" and immediately see the result of
the resulting simulation.
In addition to an advanced display of tracking data, VP1 in particular
excels in the visualisation of the ATLAS geometry, and is arguably the
most useful tool for understanding and debugging of detector
description across all subsystems. The VP1 calorimeter system is
designed to display characteristics of ATLAS Calorimeter readout
cells. Such characteristics include cell energy, time and pulse
shape. The users can interactively select calorimeter subsystems,
apply cuts and use an Athena tool for masking bad channels. Currently
the VP1 calorimeter functionality is being extended by a new system
for Calorimeter Clusters.
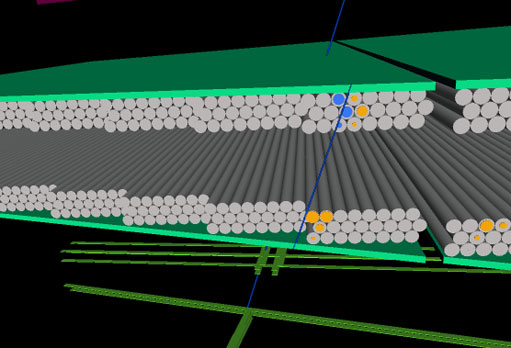 A closeup of a MDT chamber in the muon spectrometer, showing the hits
along with a reconstructed track. The track was fitted using the hits
coloured in blue, and both hits and track are projected onto the
chamber side, facilitating track debugging. In the background, TGC
hits are shown (click for larger image)
A closeup of a MDT chamber in the muon spectrometer, showing the hits
along with a reconstructed track. The track was fitted using the hits
coloured in blue, and both hits and track are projected onto the
chamber side, facilitating track debugging. In the background, TGC
hits are shown (click for larger image)
VP1 has been successfully integrated into the on-line monitoring
environment at the ATLAS control room. A special client-server
architecture for running VP1 in an online mode has been developed: One
central server application receives events during data taking,
reconstructs them and writes out a separate ESD file for every
reconstructed event. These single event ESD files are then picked up
and displayed by client applications, which can run VP1 in different
configurations on any control room desk. In addition to that, a
special 'live' mode for VP1 has been developed, allowing remote users
to display these online events on any machine outside of the control
room. Running VP1 in this mode is as simple as typing "vp1 -live", and
no further special configuration is needed.
Although this is a recent project with only a few dedicated
developers, the plugin infrastructure and Athena integration of VP1
makes it straightforward for any Athena developer to contribute to the
VP1 functionality. Thus, during the last year, around 15 different
persons made various degrees of contributions to the code, often
benefiting from 3D building code fragments previously written for the
now deprecated HEPVis/v-atlas event display. During this time, the
focus of the project has been on providing a stable application with
key plugins, and on integration in the online infrastructure at point
1.
Entering the second half of 2008 and the long awaited onset of actual
data taking, the focus of VP1 development is shifting towards end
users, aiming at completing features while striving to improve its
usability. As part of this process it is also intended to arrange
several VP1 tutorials, with specific dates to be announced at the VP1
website and hyper-news forum at a later
date.

Thomas KittelmannUniversity of Pittsburgh, USA |

Vakhtang TsulaiaUniversity of Pittsburgh, USA
|