ATLAS e-News
23 February 2011
ATLAS Tutorials
15 September 2008

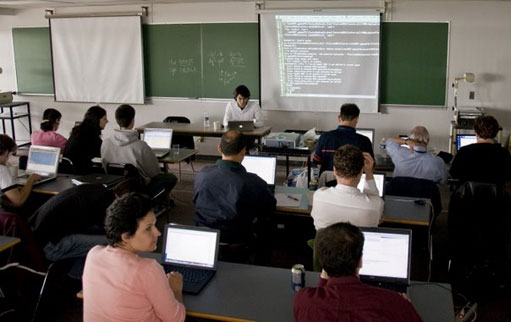
A picture taken during the Vancouver tutorial session
"I've never gone this far with a tutorial without getting stuck!" This was a really nice comment I overheard coming from one participant at a tutorial I was invited to give on Physics Analysis Tools. This took place at the end of the workshop given at Simon Fraser University in Vancouver in June. The The ATLAS Physics Workshop of the Americas was indeed a big success.
Working as a developer of PAT for years, I had given several tutorials over the past years, but making sure everything works is one of the biggest challenges for developers. I had a fairly good idea about how to structure the tutorial after a brief phone meeting with Michel Vetterli, the workshop organizer, and others who gave me both organizational and technical support for the tutorial. Thanks to our colleagues in Canada, I was able to take the tutorial to a very high quality.
Physics analysis in ATLAS is a complex project and fluency in software tools is crucial. A very simplified outline of an analysis looks roughly like this:
1. setup your environment using configuration manager, CMT
2. look for datasets to analyze using a metadata browser, AMI
3. download a few files locally using a data management tool, DQ2
4. visualize the events using an event display, ATLANTIS
5. create customized ntuples using an analysis framework such as, EventView
6. send your jobs to the Grid to process large datasets using PANDA
7. download the results using DQ2
8. make histograms using ROOT
Each of these steps requires specialized pieces of software and each one is a large project with a team of developers behind it, or sometimes two or more competing teams. Both for developers and users, tutorials are great opportunities not only to learn how to use the tools but also to discuss problems, set up contacts with colleagues and ask questions during coffee breaks between sessions.
Giving tutorials is useful for me as a developer too because I can learn what people expect from these tools. It is like doing a market survey: "What is the feature you need but is missing?", "How does this compare with what you were using before?", "How can we improve what we have?"and so on. It is also a good opportunity to think through how to do analysis from the beginning to the end and give feedback to the other developers. There is still a large amount of uncertainty about how to perform analysis in ATLAS but to some extent, it is necessary because we need to be flexible to deal with the situations that may arise. This is not to say that we are not ready, we have already discussed a variety of potential issues and there are good reasons to stay optimistic about our ability to handle real data when they arrive.
In addition to the Vancouver tutorial mentioned earlier, a number of other tutorials are available now and more will appear in the coming months and years. The ATLANTIS event display tutorial was held in June at CERN, which was a tutorial specifically on this particular event display tool. ATLAS Offline Software Tutorial was organized in July and in August to feature a series of small tutorials over three days, covering a full range of topics. These are the first two of the monthly event organized by James Catmore (james.catmore@cern-NOSPAM.ch). Analysis jamborees are held at Brookhaven National Lab in the US every few months such as the one in June and in September (with ANL and LBNL). The jamborees bring experts and users together in free working sessions with little fixed agenda. A number of regional events are organized from time to time in addition to these and some may not even be advertised well enough.
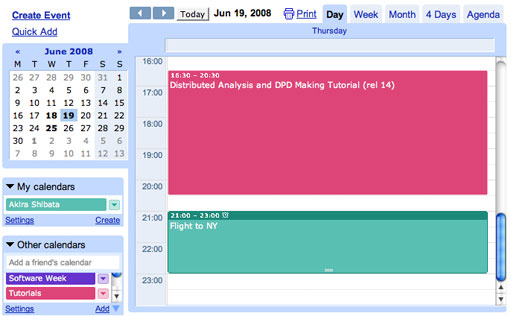
The best way to get information about the upcoming tutorial events is to stay in touch with the community. At CERN, there is the hn-atlas-offlineSWHelp@cern-NOSPAM.ch hypernews, which is used for announcement of new tutorials and hn-atlas-SWDevelopersAnnounce@cern-NOSPAM.ch, which is used by developers to organize these events. Every local community tends to have e-mail lists like this. Tutorials developers should make sure their tutorials are referred to in the ATLAS computing workbook and physics workbook. The PAT wiki page has links to some recent tutorials but probably we should try to keep such information on INDICO, and indeed there is a category for tutorials already. INDICO is great for event organizers and it has RSS feed and ical, which you can subscribe to with your favorite news reader or calendar (I know many people use google reader and google calendar for example). With these tools, you can receive automatic notifications whenever new tutorial events are added. In general, ATLAS can use more of these web technology tools to advertise tutorials when they become available. I'm sure many people who use google calendar didn't know about ical from INDICO. Hopefully, the ATLAS e-news will get RSS feed soon!

A Google calendar subscribed to INDICO ATLAS tutorial category
Finally, some tips for tutorial goers. A PAT tutorial is like a band giving a concert (but not throwing laptops). A concert becomes a good show when there is a good audience. People go to tutorial with different purposes but it probably helps to decide why you are going to the tutorial so you can get the most out of it. Some people like to just observe during the tutorial and follow them at home. If that is what works for you, that's great. I recommend that you get your hands dirty, sometimes competing with the other participants to be the first one to make histograms. In the end, we all do this for fun.

Akira ShibataNew York University
|