
ATLAS e-News
23 February 2011
Tracking material with the Electromagnetic Calorimeter
28 June 2010
Knowing the position and amount of material in the tracker is a prerequisite to reach nominal performance for electrons and photons. A detailed description of this material (including services), based on information coming from the construction and installation phases, is implemented in the full GEANT4 detector simulation. By measuring the occupancy in the ATLAS electromagnetic calorimeter in 5 million minimum bias events, it is already possible to test to a very good precision level (∼0.1 radiation lengths) this implementation of the inner detector services in the simulation. The results show an overall good agreement between data and simulation but also point to some local incorrectness in the present Monte Carlo simulation.
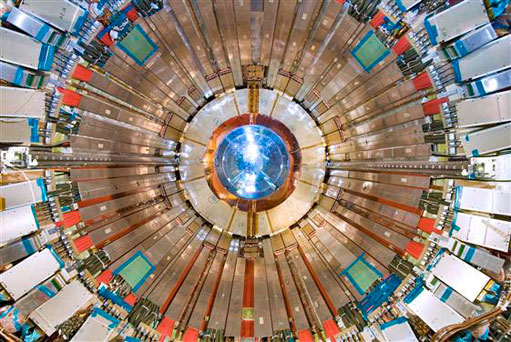
Picture of the inside of the inner wall of the barrel electromagnetic calorimeter after the insertion and cabling of the barrel SCT-TRT. The horizontal rails, supporting the barrel and end-cap SCT-TRT, as well as cables and cooling pipe trays of the barrel SCT-TRT running at constant φ are clearly visible.
ATLAS analyses of the first LHC data have proven that the detector is performing well and that the simulation already reproduces quite accurately many of the detailed features of the data. However, a lot of work remains to be done, for example on the non-uniformity in φ of the tracker material description, mainly caused by the inner detector services and rails running on the inner wall of the barrel electromagnetic cryostat as shown on the above figure. A dedicated study, entirely based on the electromagnetic calorimeter, was developed and applied to first data. Contrary to photon conversions studies, it does not provide the location of the material, but is sensitive to any non-uniformity in φ of the whole material in front of the calorimeter.
This analysis uses a few million minimum bias events recorded in early April 2010 at a centre of mass energy of 7 TeV, triggered and selected with the Minimum Bias Trigger Scintillators. Counting the number of energy deposits above 5 times the measured electronic noise in all electromagnetic calorimeter cells allows a channel-by-channel check of the response to physics. This method allowed us to identify a readout cabling inversion and a high voltage cable swap, affecting 0.4% of the total number of cells in the region |η| < 2.5 Both problems have been corrected subsequently and will not affect the electron/photon reconstruction in the 2010-2011 run.
The main goal of this analysis is to provide a first check with data of the total amount of material in front of the electromagnetic calorimeter. To a good approximation, the event activity is expected to be symmetric in φ. Any occupancy non-uniformity in φ can therefore be attributed either to the EM calorimeter response, (which was shown in beam tests to be uniform to better than 1%), or to the integrated material in front of it.
The presence of additional material in front of a geometrical region of the calorimetry lowers the deposited energy and therefore the occupancy in that region. The Inner Detector (ID) services running at specific φ on the calorimeter cryostat introduce large non-uniformities in the amount of material, up to 1 radiation length (X0). This is illustrated in the figure below, where the occupancy measured in the EM calorimeter minus the average found elsewhere is lower than zero for all cells located behind the ID rails.
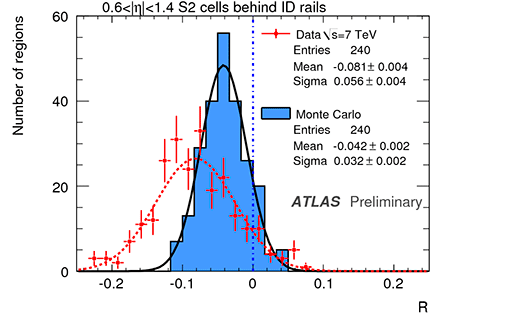
Occupancy measurement with respect to the average (in %) for cells located behind the ID rails. The negative distribution mean, both for data and Monte Carlo, reveals the presence of additional material in front of the calorimeter. With a shifted mean twice as large in data than Monte Carlo, it is clear that more material is seen in data than was put in the simulation.
The occupancy analysis in cells located behind the ID services allow us to see and probe the material. The SCT heat exchangers and TRT barrel services account for ∼0.2 X0. Their simulation is found to be in good agreement with the data. However, up to one X0 of material is missing in the ATLAS simulation for the localised regions close to the rails supporting the inner detector. As shown in the figure below, the effect extends along φ up to Δφ = ±0.1 around 0 and π, affecting 2% of the EM barrel coverage. Discussions are ongoing with the experts, and some hints of what pieces could be missing exist. Corrections could be implemented in an updated Monte Carlo geometry.
This study will be further extended to the end-cap regions. All these results have been reported in a note recently approved for the Physics at LHC conference.
Average number of X0 in front of the EM barrel presampler versus φ per bin Δφ = 2 π/256 for 0.6 < |η| < 1.4. The filled histograms are for Monte Carlo, whereas the points are extrapolated from data occupancy in the second EM layer cells located behind the ID rail regions.


Fabrice Hubaut and Pascal PralavorioCentre de Physique
|