
ATLAS e-News
23 February 2011
What can multivariate analysis techniques buy you?
9 March 2009
Often an analysis in particle physics is limited by the available number of events. One of the main goals is to get as much information as possible out of a limited set of data. A traditional analysis usually uses a few cuts on variables having some discrimination power to select interesting signal events from a possibly large background. Multivariate analysis techniques (MVA) involve the observation and analysis of more than one variable at a time and can possibly lead to larger selection efficiencies.
To illustrate the use of MVA techniques, take as an example a study we performed on Higgs boson decays. If the Higgs mass ranges between 135 and 200 GeV, it will predominantly decay into W boson pairs. The W bosons are reconstructed from their decay into muons and neutrinos.
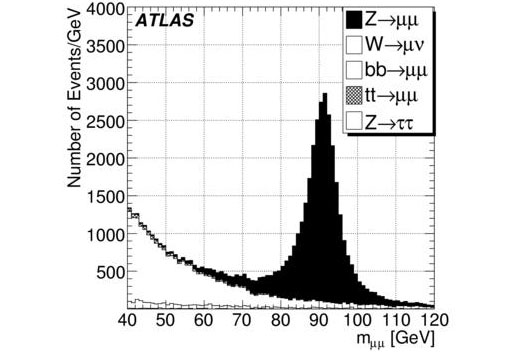
The invariant mass distribution from various Standard Model sources calculated from the two muon momenta. This plot comes from a similar analysis published recently as a CSC note.
The figure shows the distribution of the invariant mass calculated from the two muon momenta. At mμμ=91 GeV, one can easily recognize the Z boson resonance, while at lower masses the Higgs signal would be located on top of many different large background. This makes it very difficult to extract the signal and this is where MVA techniques can help.
As a baseline, it is a good idea to start with a cut-based analysis which tries to separate the signal from the background by exploiting the differences in the kinematic and topological properties of the events. This method already yields a good ratio of the number of signal events divided by the uncertainty on the number of background events, (the signal significance) which is often used as a first indicator for the performance of such a search. We then compared several multivariate methods to this baseline analysis: we have studied neural networks, boosted decision trees, bagged randomized trees and the Fisher classifier.
The problem at hand is to find the region in the multidimensional space of event variables where the signal significance is largest. In a traditional cut analysis, such a region is specified by ''cutting'' on individual variables: The signal region can only be a region with borders defined by hyperplanes. Multivariate methods can describe more complicated signal regions by using many variables simultaneously.
Multivariate classifiers often have many parameters. Unlike cuts where the cut values are most often determined by hand, these parameters often have little physical meaning and therefore, have to be determined from simulated data.
This leads to the separation of “training” and “testing”. Firstly, on a training dataset, the parameters for the multivariate methods are determined by the training algorithms. Secondly, the efficiency of the selection is determined on a testing dataset - this dataset must be statistically independent from the training dataset, or it would lead to extremely optimistic results. Another reason to use separate datasets is the effect known as overtraining: A classifier with many parameters, for example a decision tree, can “over-adapt” to the training sample, and show a very high efficiency. On an independent dataset, the efficiency would however be very different.
We therefore also applied this separation of training and testing datasets to the optimisation of cut positions in the cut-based analysis. Even though the effect was less pronounced than for the multivariate methods, we observed some overtraining after optimising the cuts, leading to an initial overestimation of the analysis performance.
The simplest specification of a signal region with the fewest parameters is the Fisher classifier. The Fisher score of an event is just the sum of the considered event variables, each multiplied by a parameter. An event is in the signal region if the score is higher than another parameter - this means that the signal region is one side of a hyperplane. More complex can be the shape described by an artificial neural network; however, many more parameters are necessary. With decision trees, even stranger shapes are possible, but the number of parameters is very large, making these methods most susceptible to overtraining.
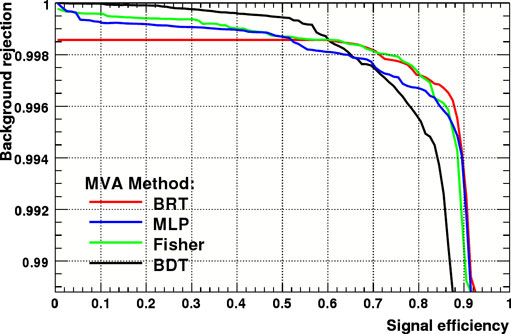
Typical background rejection versus signal efficiency curves for boosted decision trees (BDT), bagged randomized trees (BRT), multilayer perceptrons (MLP, artificial neural networks) and the Fisher classifier. For a signal efficiency of 50%, the method giving the best background rejection in this case is the BDT.
As an example for the performance of the methods, the signal efficiency is plotted against the background rejection for the four examined methods shown in the figure above. These curves can be used to determine the best working point for each method.
Advanced methods to describe the signal region - in contrast to a cut analysis - are most useful in situations where the actual signal region is far from a region that can be described by simple cuts. If the cut analysis is close to optimal, the benefits of using multivariate methods are small. If backgrounds with more complex decay topologies are important, the strength of multivariate analysis shows - boosted decision trees, for example, can improve upon cut analysis by a factor of two in significance.
However, the gains from multivariate analysis must always be carefully balanced with the systematic uncertainties introduced. To accurately determine these systematic uncertainties when working with multivariate methods, we have repeated the analysis for a set of 400 “distortion points”, where at each point each systematic uncertainty was varied, so that the correlations introduced by using multivariate methods could be examined. This method was compared with the usual individual variation of the systematic uncertainties.
One interesting result is that the correlations introduced by multivariate methods can make the analysis much more susceptible to systematic uncertainties. Also, while both methods to estimate systematic uncertainties gave similar results for the cut analysis, for multivariate methods the method that did not include the correlations gave much smaller uncertainties than the method including full correlations. If the systematic uncertainties and their correlations are carefully constrained by using data, multivariate analysis can however increase the sensitivity of an analysis significantly.
In our analysis the boosted decision trees method gave the largest improvement if no systematic uncertainties were considered. However, it takes a long time to train and is also relatively slow in application. In contrast, while the Fisher classifier performs worse, it has an extremely low training and application time, and can be useful in situations where speed is essential. Finally, in the presence of strong systematic uncertainties the bagged randomized tree method showed the best performance and robustness.

Johannes ElmsheuserLudwig-Maximilians-Universität München |

Johannes EbkeLudwig-Maximilians-Universität
|